Introduction
While working on a CTF-style challenge recently I was introduced to Node.js. Now I have dealt with it before, and have done my share of web development using JavaScript so I’m not stranger to its intricacies, but this was the first time I’ve dealt with it server-side.
This challenge, specifically, had an implementation of safe-eval version 0.3.0. If you’re familiar with it, you may know that this has a well-known vulnerability (CVE-2017-16088) which allows a sandbox escape. Now the point of this post wasn’t to talk about this challenge or the vulnerability, but rather how I ended up identifying the next step in the exploitation process using remote debugging with VS Code.
Getting Started
If you haven’t used Visual Studio Code, you really don’t know what you’re missing. I was hesitant about using another Microsoft product (muh telemetries!?) but those worries are mitigable (pretty sure that’s a real word) via the horse’s mouth here. This editor has become my go-to for everything. It easily beats TextEdit.app’s startup time (incredibly frustrating). There’s an impressive number of plugins available (including ones for Vim keybindings), and (as is the point of this post) has support for Node.js debugging built right in!
The first step is getting it installed. Head over to https://code.visualstudio.com/. They aren’t joking about the “Free. Built on open source. Runs everywhere.” bit, I have it installed on my Mac, Windows laptop, and various Linux VMs. Follow the instructions for your platform, install it, and launch it.
Look at that beautiful editor, marvel at it. Click around, get comfy, install your favorite language plugin and be amazed it can take advantage of your system’s interpeter or install one if you don’t already have one. You like Java? There’s a whole kit for you crazy people, too. Come back here when you’re ready to move on.
Modifying launch.json
If you attempt to do any debugging without first opening a file (what exactly are you expecting here?) you may end up seeing the following error.
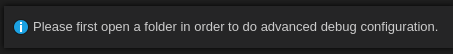
If that’s the case… well, follow the instructions and use the File menu to open a folder. It doesn’t really matter which one at this point, but do know that the configuration file you edit below (launch.json) is going to live under the project folder you select, in the .vscode/ folder.
If you’ve tried some local debugging already, you may have clicked here and there, tried to start debugging, and maybe run up against something similar to the following.
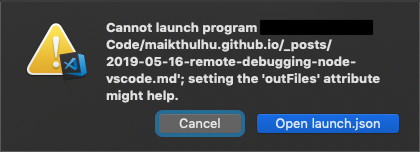
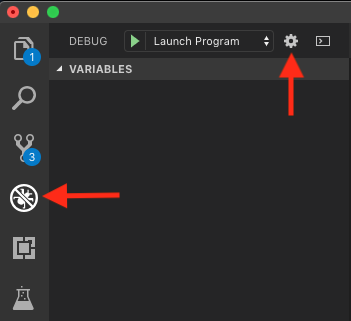
Nevermind me trying to debug a markdown document, there’s that “Open launch.json” button. If you’re not familiar with VS Code, that file is what contains the various definitions used for launching and/or debugging your projects. If you click that button, launch.json will open in a new tab. If you don’t happen to encounter that button, click the debug button on the left (the little bug icon with the no circle on it), then click the gear icon next to the play and launch program selections near the top.
If it asks you which environment to choose, select Node.js and continue. You’ll then likely end up looking at something simliar to the following.
{
    // Use IntelliSense to learn about possible attributes.
    // Hover to view descriptions of existing attributes.
    // For more information, visit: https://go.microsoft.com/fwlink/?linkid=830387
    "version": "0.2.0",
    "configurations": [
        {
            "type": "node",
            "request": "launch",
            "name": "Launch Program",
            "program": "${file}"
        }
    ]
}
At its core, that is the list of configurations you can use to debug a Node.js project. Of course that’s just for local debugging, and isn’t very fancy. What we need to do is add a configuration for remote debugging. Modify the code to match what’s below and then I’ll explain some of it.
{
    // Use IntelliSense to learn about possible attributes.
    // Hover to view descriptions of existing attributes.
    // For more information, visit: https://go.microsoft.com/fwlink/?linkid=830387
    "version": "0.2.0",
    "configurations": [
        {
            "type": "node",
            "request": "launch",
            "name": "Launch Program",
            "program": "${file}"
        },
        {
            "type": "node",
            "request": "attach",
            "name": "Attach to remote",
            "address": "localhost",
            "port": 9229
        }
    ]
}
As you can see we added another node-type configuration, set its request type to attach, given it an arbitrary name “Attach to remote”, specified our localhost as the address of the process we want to debug, and set the port to attach to as 9229. You may find yourself asking, “Self, how do I connect to something remote if I’m specifying localhost? That doesn’t sound very remote at all.” Right you are, my friend. We’re gonna tunnel this bad boy.
Tangent: SSH Tunnel
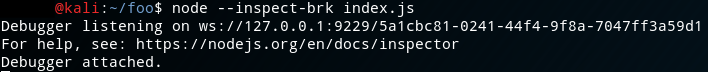
The default debugging configuration for Node.js is to listen only on the loopback interface on port 9229. By binding to that address (127.0.0.1) all remote connections will be refused. You can confirm this by launching node with --inspect and observing the following.
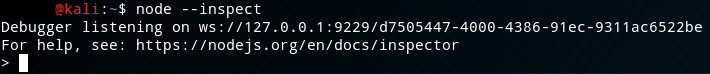
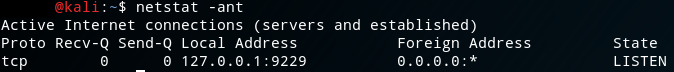
You can further confirm this by inspecting the output of netstat -ant (or the equivalent on your platform) and seeing that it specifically binds to 127.0.0.1:9229 as you can see in the following.
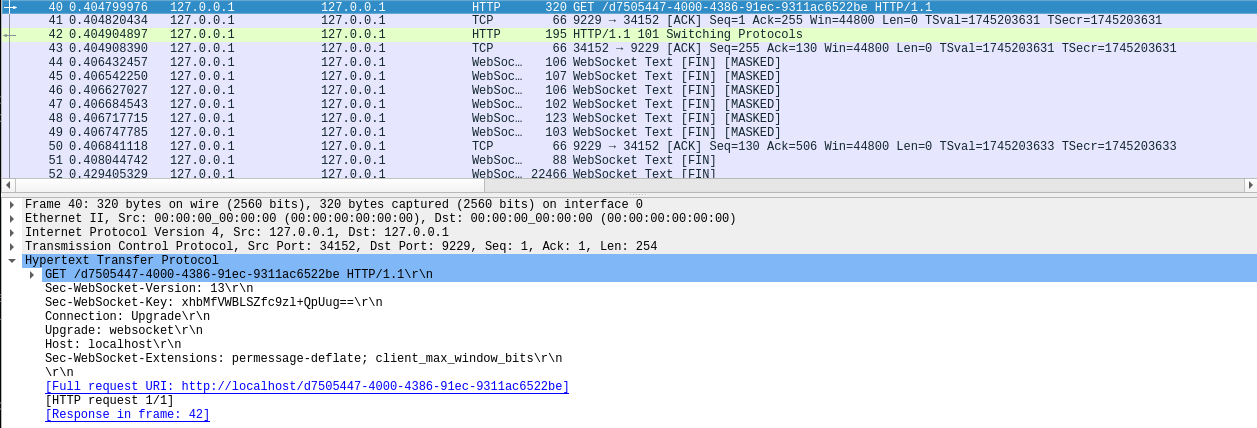
This is a good thing! Notice that ws:// protocol descriptor? That stands for WebSocket. WebSockets are increasingly how the active web content world tends to work, but more importantly, the traffic is sent in the clear. That’s right, there’s no native encryption here. Now WebSockets does have a mechanism for attempting to prevent the reading of arbitrary bytes on the wire, and for more information on that I suggest you turn to Google or, if you’re up for some light reading, RFC6455 which defines WebSockets. This feature doesn’t (please correct me if I’m wrong) protect a full on packet capture as the “keys” used to XOR the data in transit are also transmitted in the clear.
The best way to ensure we are as secure as we can be is to employ an SSH tunnel. What this allows us to do is open an SSH session to our remote system and then tunnel all of our traffic from our local system (where we’re running VS Code) to the remote system over a specified port. All traffic sent over this tunnel will be encrypted and we can do our debugging without (too much) worry of snoopers.
To initiate a local SSH tunnel, SSH of course needs to be running on our target, and then you can issue the following command:
ssh -L 9229:127.0.0.1:9229 maik@remote-node-host
Here’s a breakdown of the parameters above:
-Ltells ssh to initiate a local tunnel, where a local port will listen for local connections to tunnel traffic9292:is the port number ssh will open locally127.0.0.1is the destination host we want to tunnel to relative to the remote host (so localhost because that’s what the debugger is bound to):9292is the destination port we want to tunnel to on the destination host abovemaik@remote-node-hostis the username@hostname you would normally use to initiate an ssh connection
Ultimately this allows our VS Code debugger to tunnel from its own localhost:9229 and be redirected to 127.0.0.1:9229 on the remote host, where that otherwise wouldn’t be possible, all while being fully encrypted.
Debugging safe-eval
Now back to our regularly scheduled program. The following commands set up a quick environment for me to remotely test and debug safe-eval@0.3.0.
Create a folder and cd into it.
mkdir debugging && cd $_
Install safe-eval version 0.3.0.
npm install safe-eval@0.3.0
Create a test file to debug with. I made index.js with the following contents.
safeEval = require('safe-eval');

context = { bob: { alice: 'secret' } };

safeEval("return 1+1;", context);
Invoke Node.js and enable debugging, but have it break immediately for the debugger.
node --inspect-brk index.js
Initiate the SSH tunnel:
ssh -L 9229:127.0.0.1:9229 maik@kali
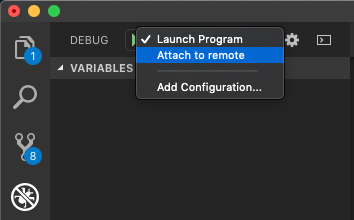
Attach your local VS Code to the remote debugger by selecting the configuration we created earlier and then click the play button to begin debugging.
If all goes well we should see the remote Node.js console report a debugger was attached.
And then VS Code will show us just how amazing these features are!
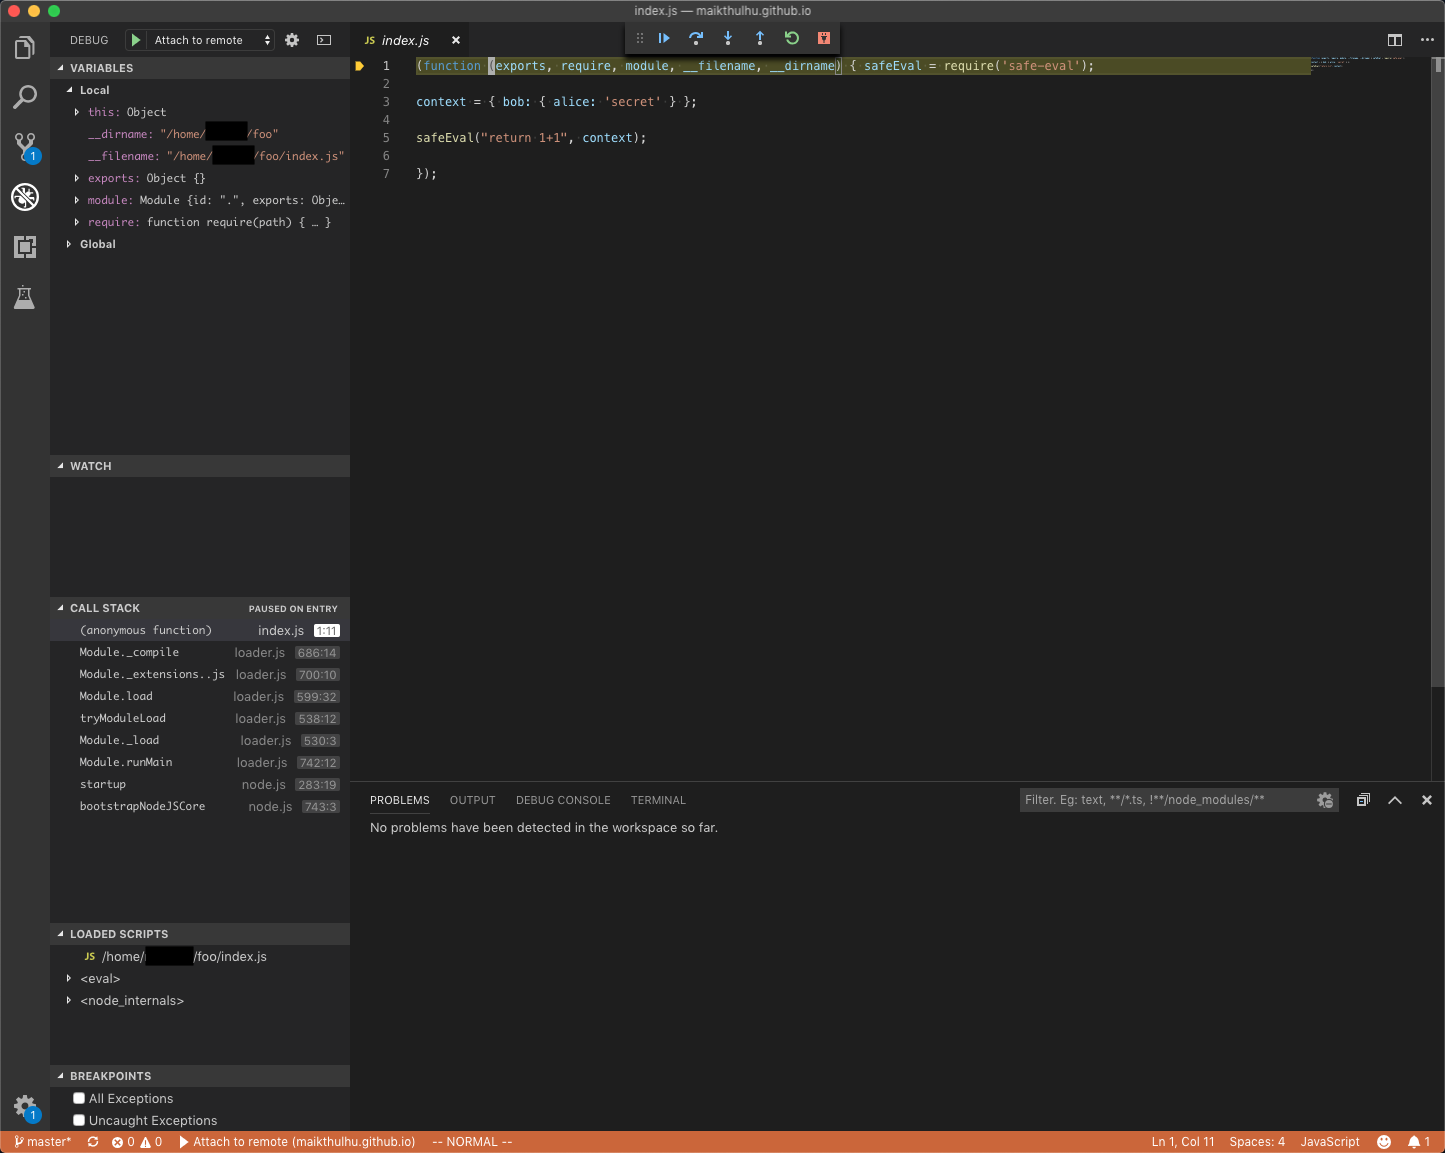
Look, there’s our code right there! And on the left we can see the local variable scope!! We even have debugging controls in the toolbar at the top, and a handy dandy debug console at the bottom!!!
You can step over or into code. See how it shows us the call stack and loaded scripts? Wanna see what happens when we step into safeEval as it’s running? Try it! Hit the step over button (right arrow) three times, then the step into button (down arrow) once.
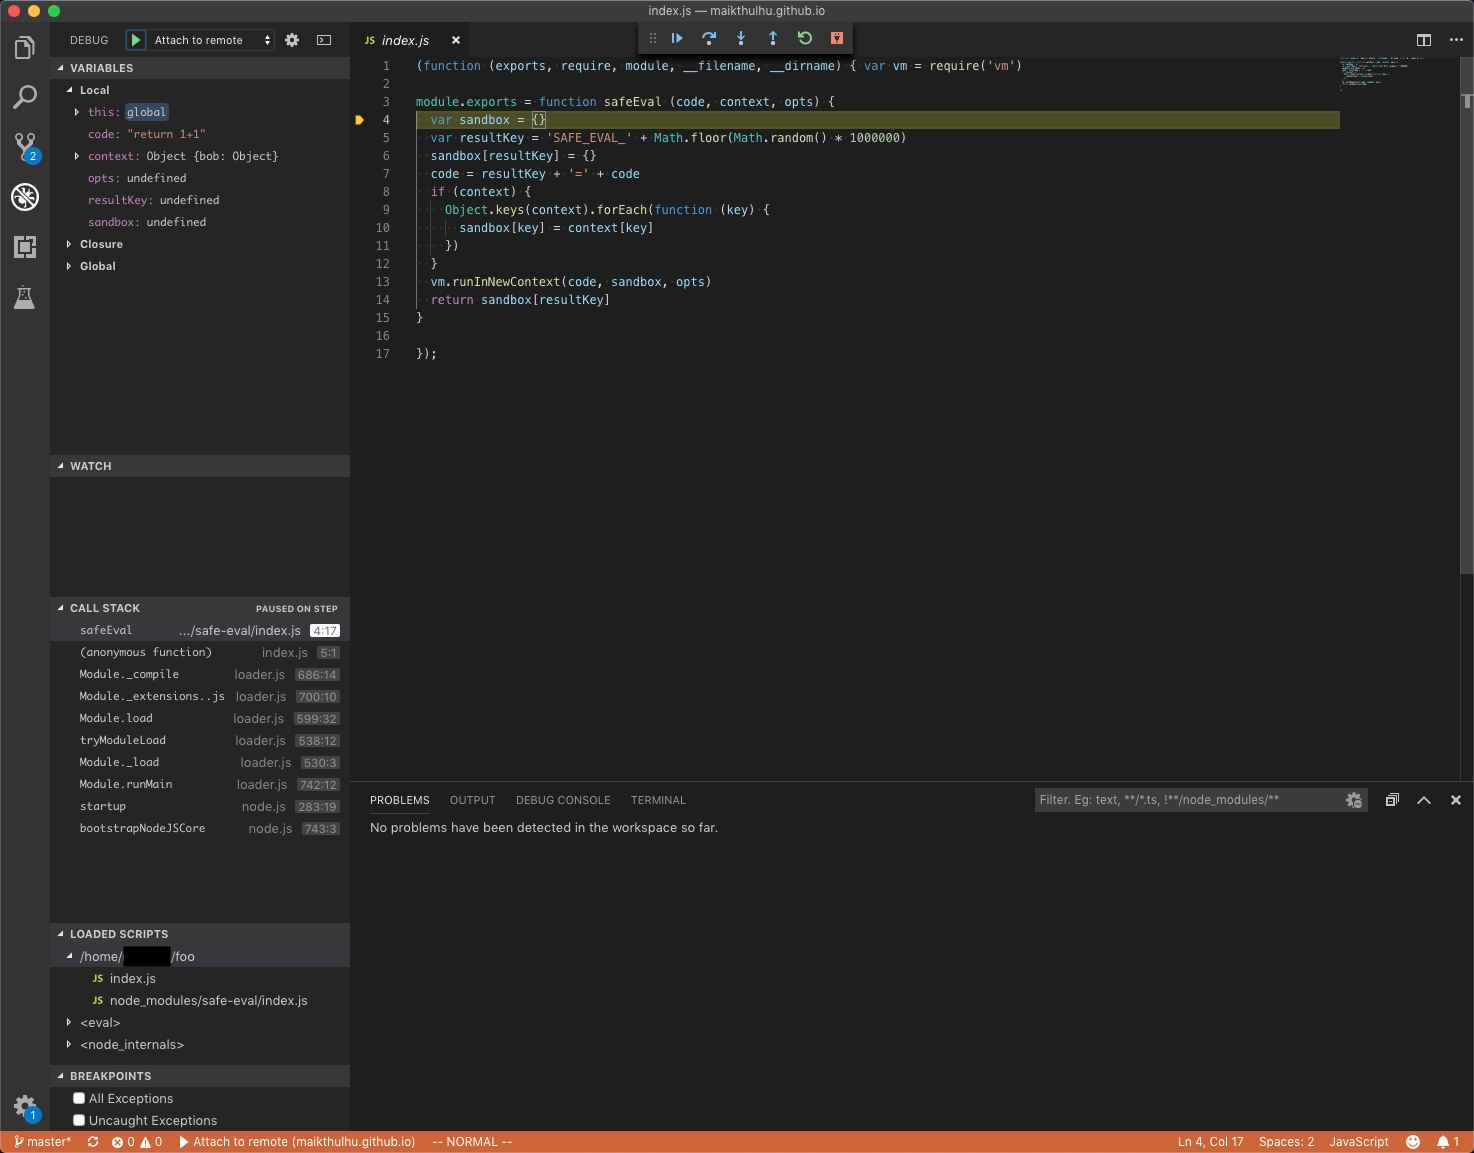
Now we’re on the first line of the implementation of safeEval! We can see on the left our local scope has channged and we have access to the values passed in (code as a string literal, context as an object, etc) as well as the local function variables.
Want to take it further? I know you do. Step over until line 13, and then step into the call to vm.runInNewContext(). Step over again until line 296 and then step into the call to createScript(). We’re almost to where we want to be in this rabbit hole. Step into the call to new Script().
Curious and curiouser… We land in the Script class constructor. Script is a sublcass of ContextifyScript. If we step through the constructor far enough we end up in a try/catch which calls super() (the constructor of the super class of Script - ContextifyScript) with a bunch of parameters including the code we are attempting to run in code and the context we passed in parsingContext.
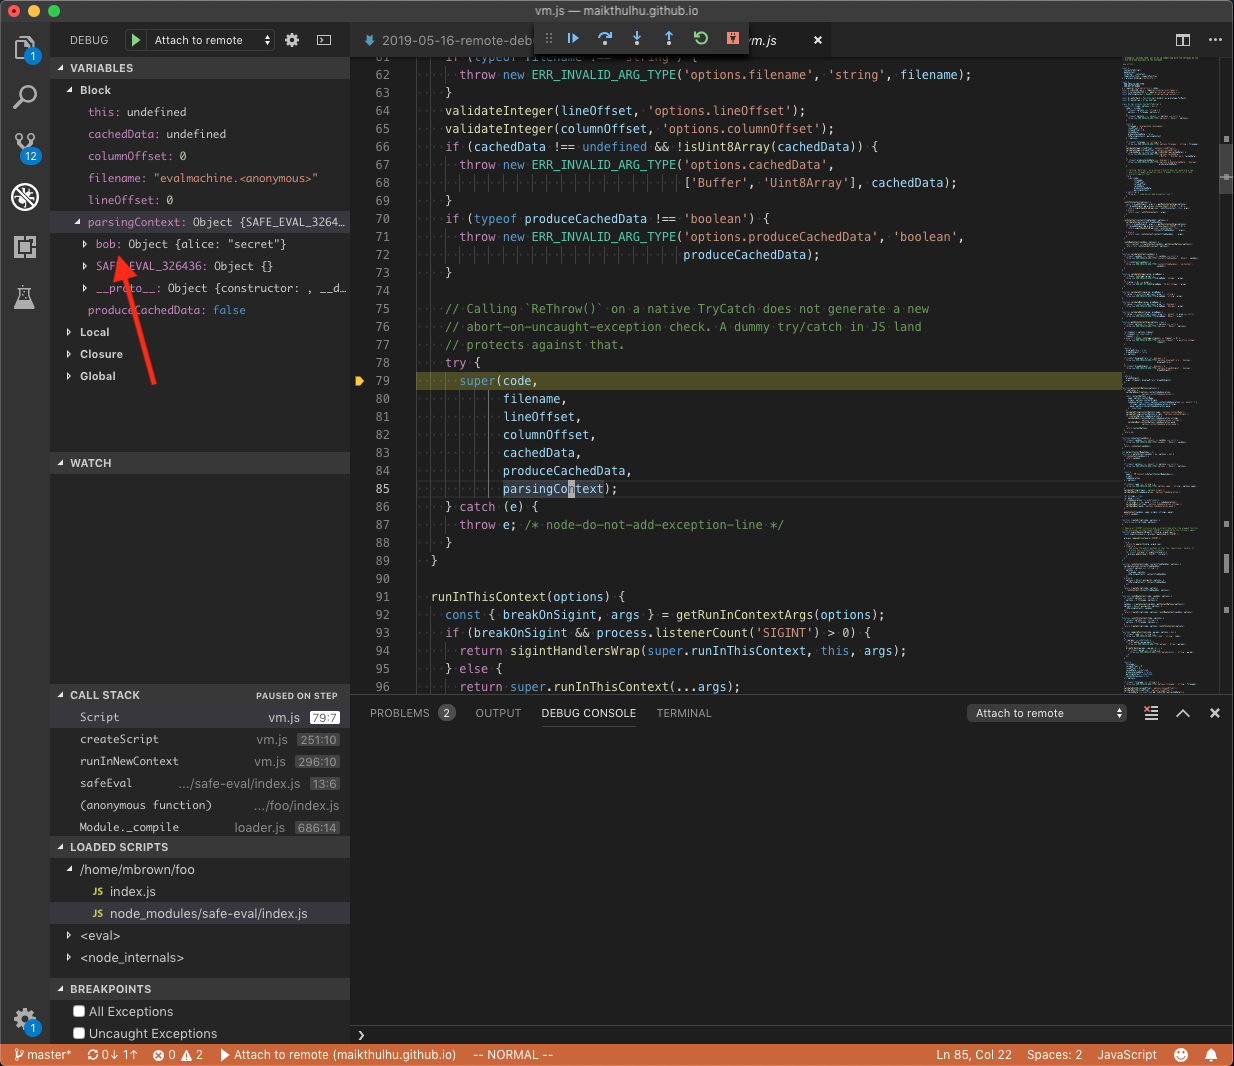
As we can see there, parsingContext shows us we have access to our bob object, which is what we should expect. What’s fun, though, is because bob was created outside the vm instance, we could use that to climb back out of the sandbox as well. Fortunately, the current context object itself is enough to climb back out with.
Conclusion
Lots of fun to be had indeed! There’s one last thing I wanted to hit on that I’ve always loved about Visual Studio and now VS Code too. Intellisense! The challenge I was working on had some specific requirements. I needed to figure out how to reference other node modules in the global scope after escaping the vm sandbox.
As I was poking around in the debug console, I found a reference and was exploring the process object just to see what I could see. Lo and behold, as I hit process. the IntelliSense popup came up. I saw that process.mainModule.children contained some other modules that I might be able to explore, but as I backspaced a bit to see what else was available, what should grace my eyes, but a reference to require!! I was then able to slightly modify my exploit code and add the needed reference to require and then pop the reverse shell.